Software publisher (marketing automation and CRM)
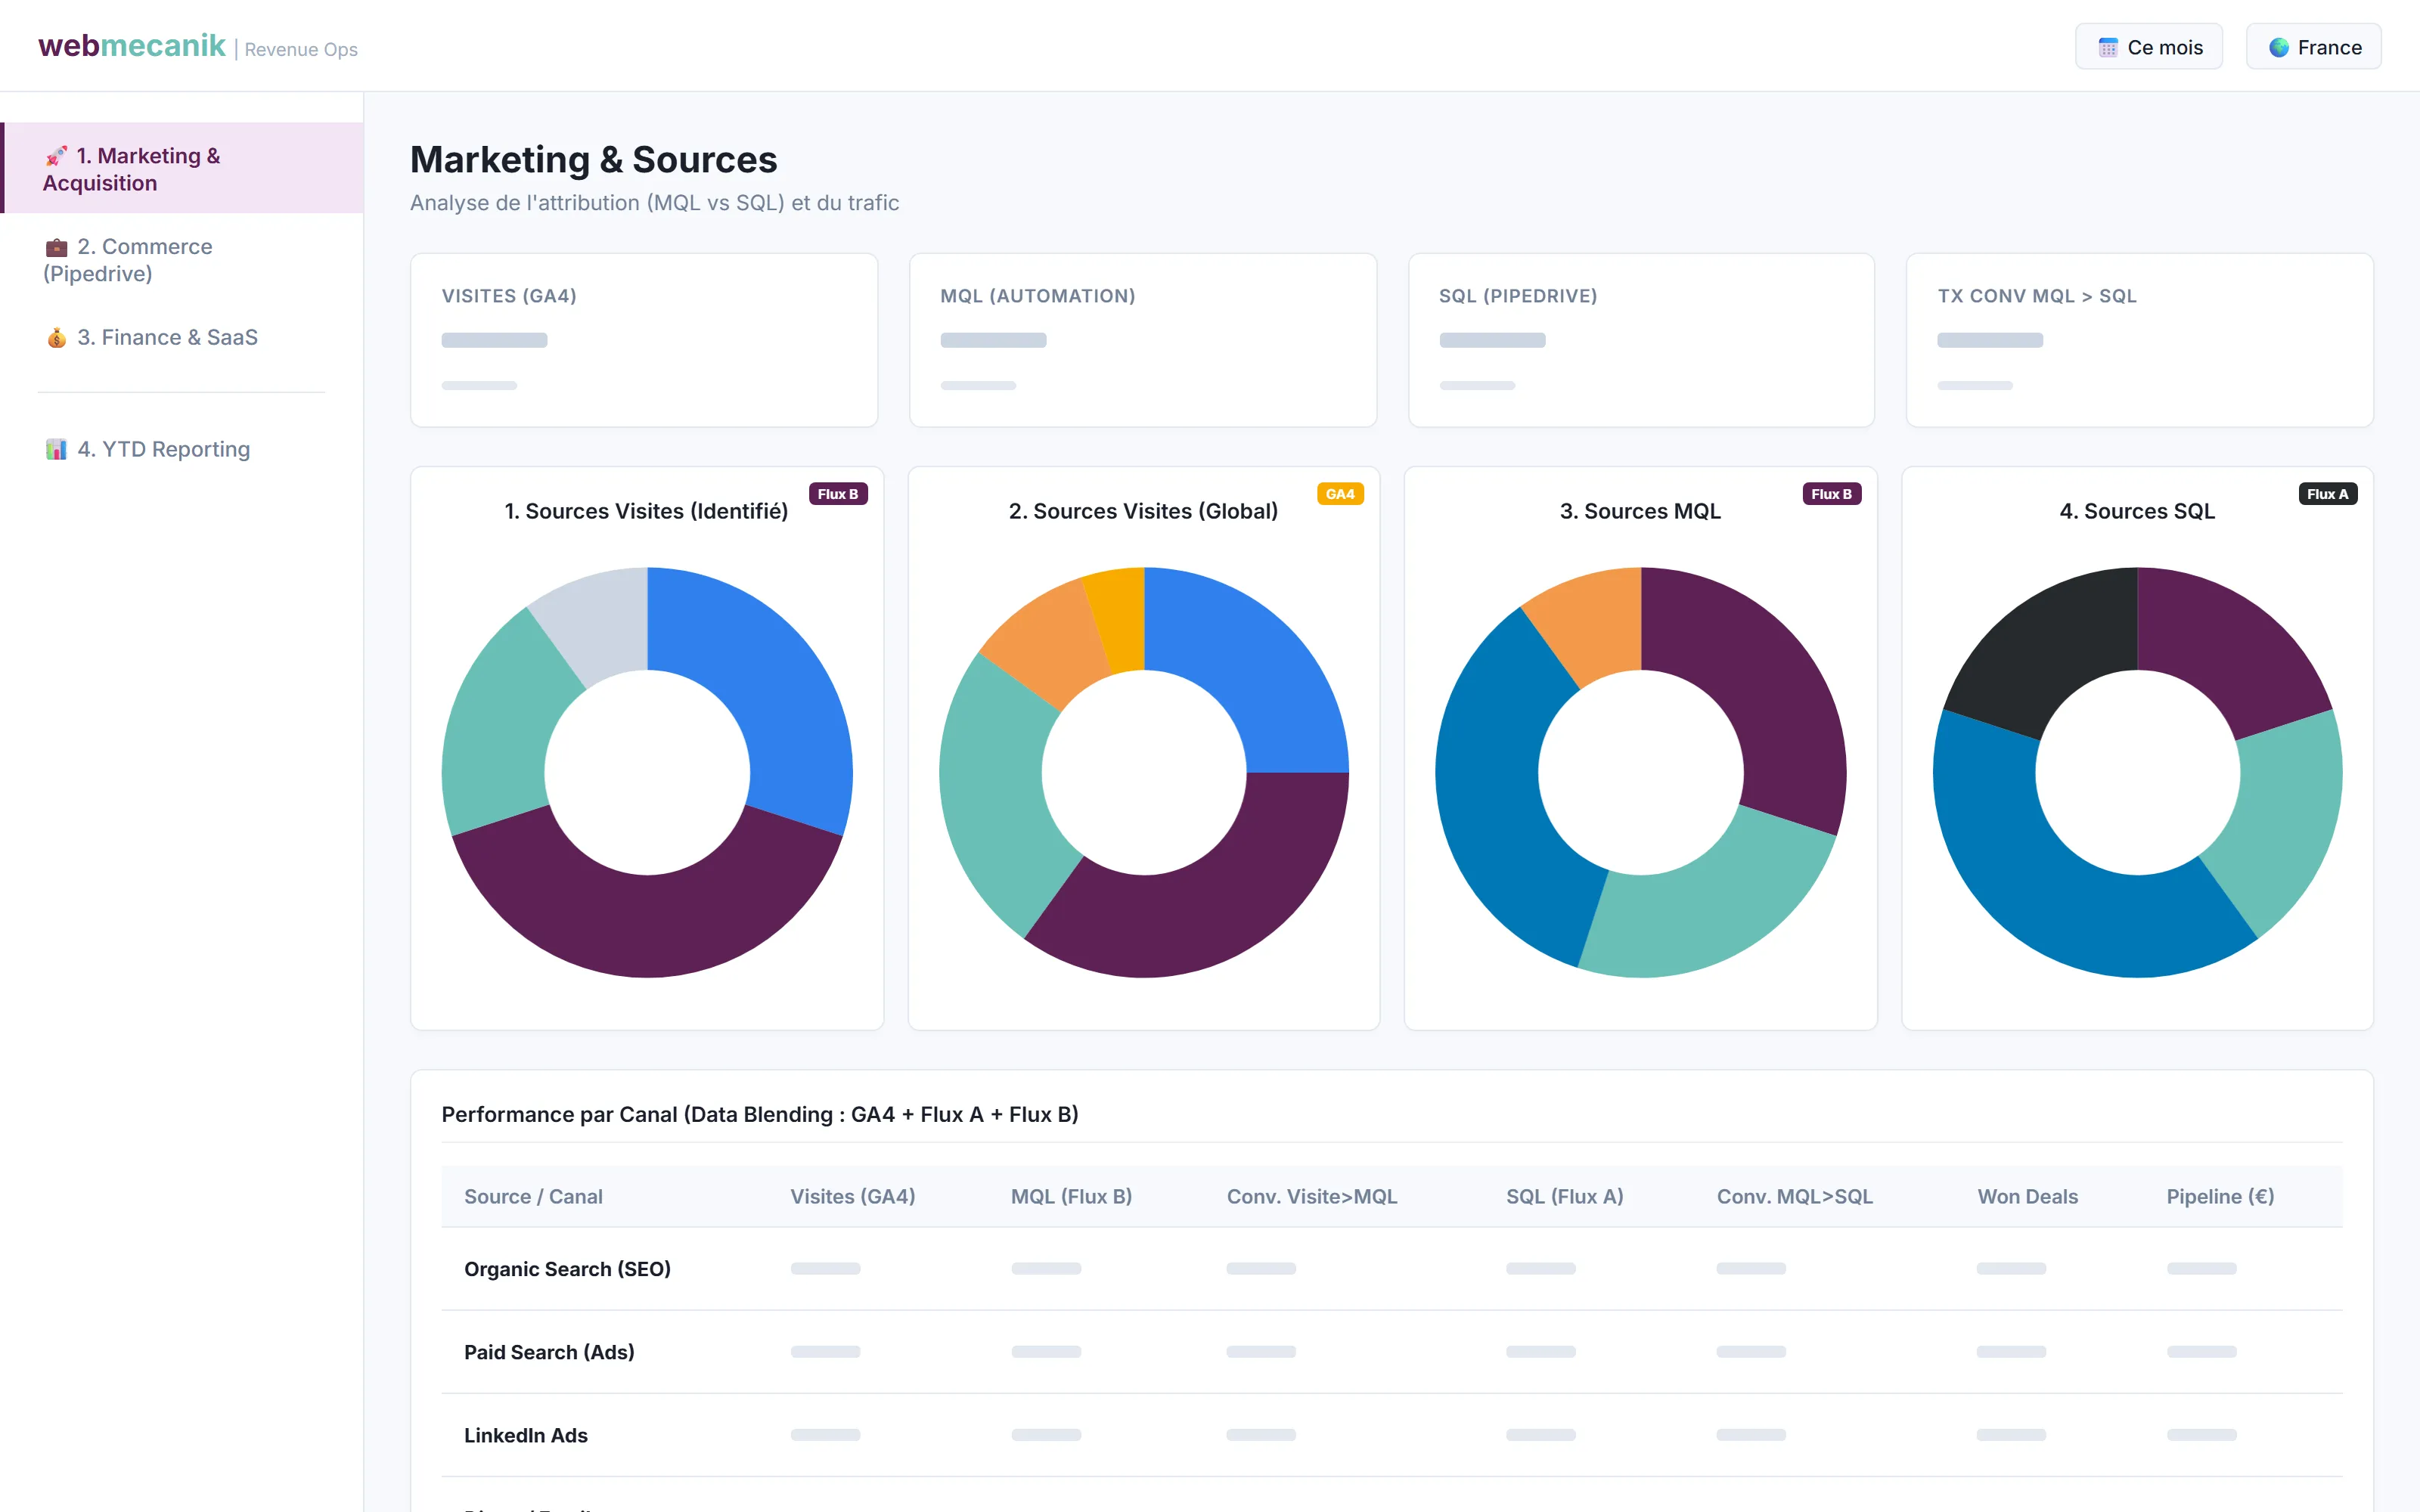
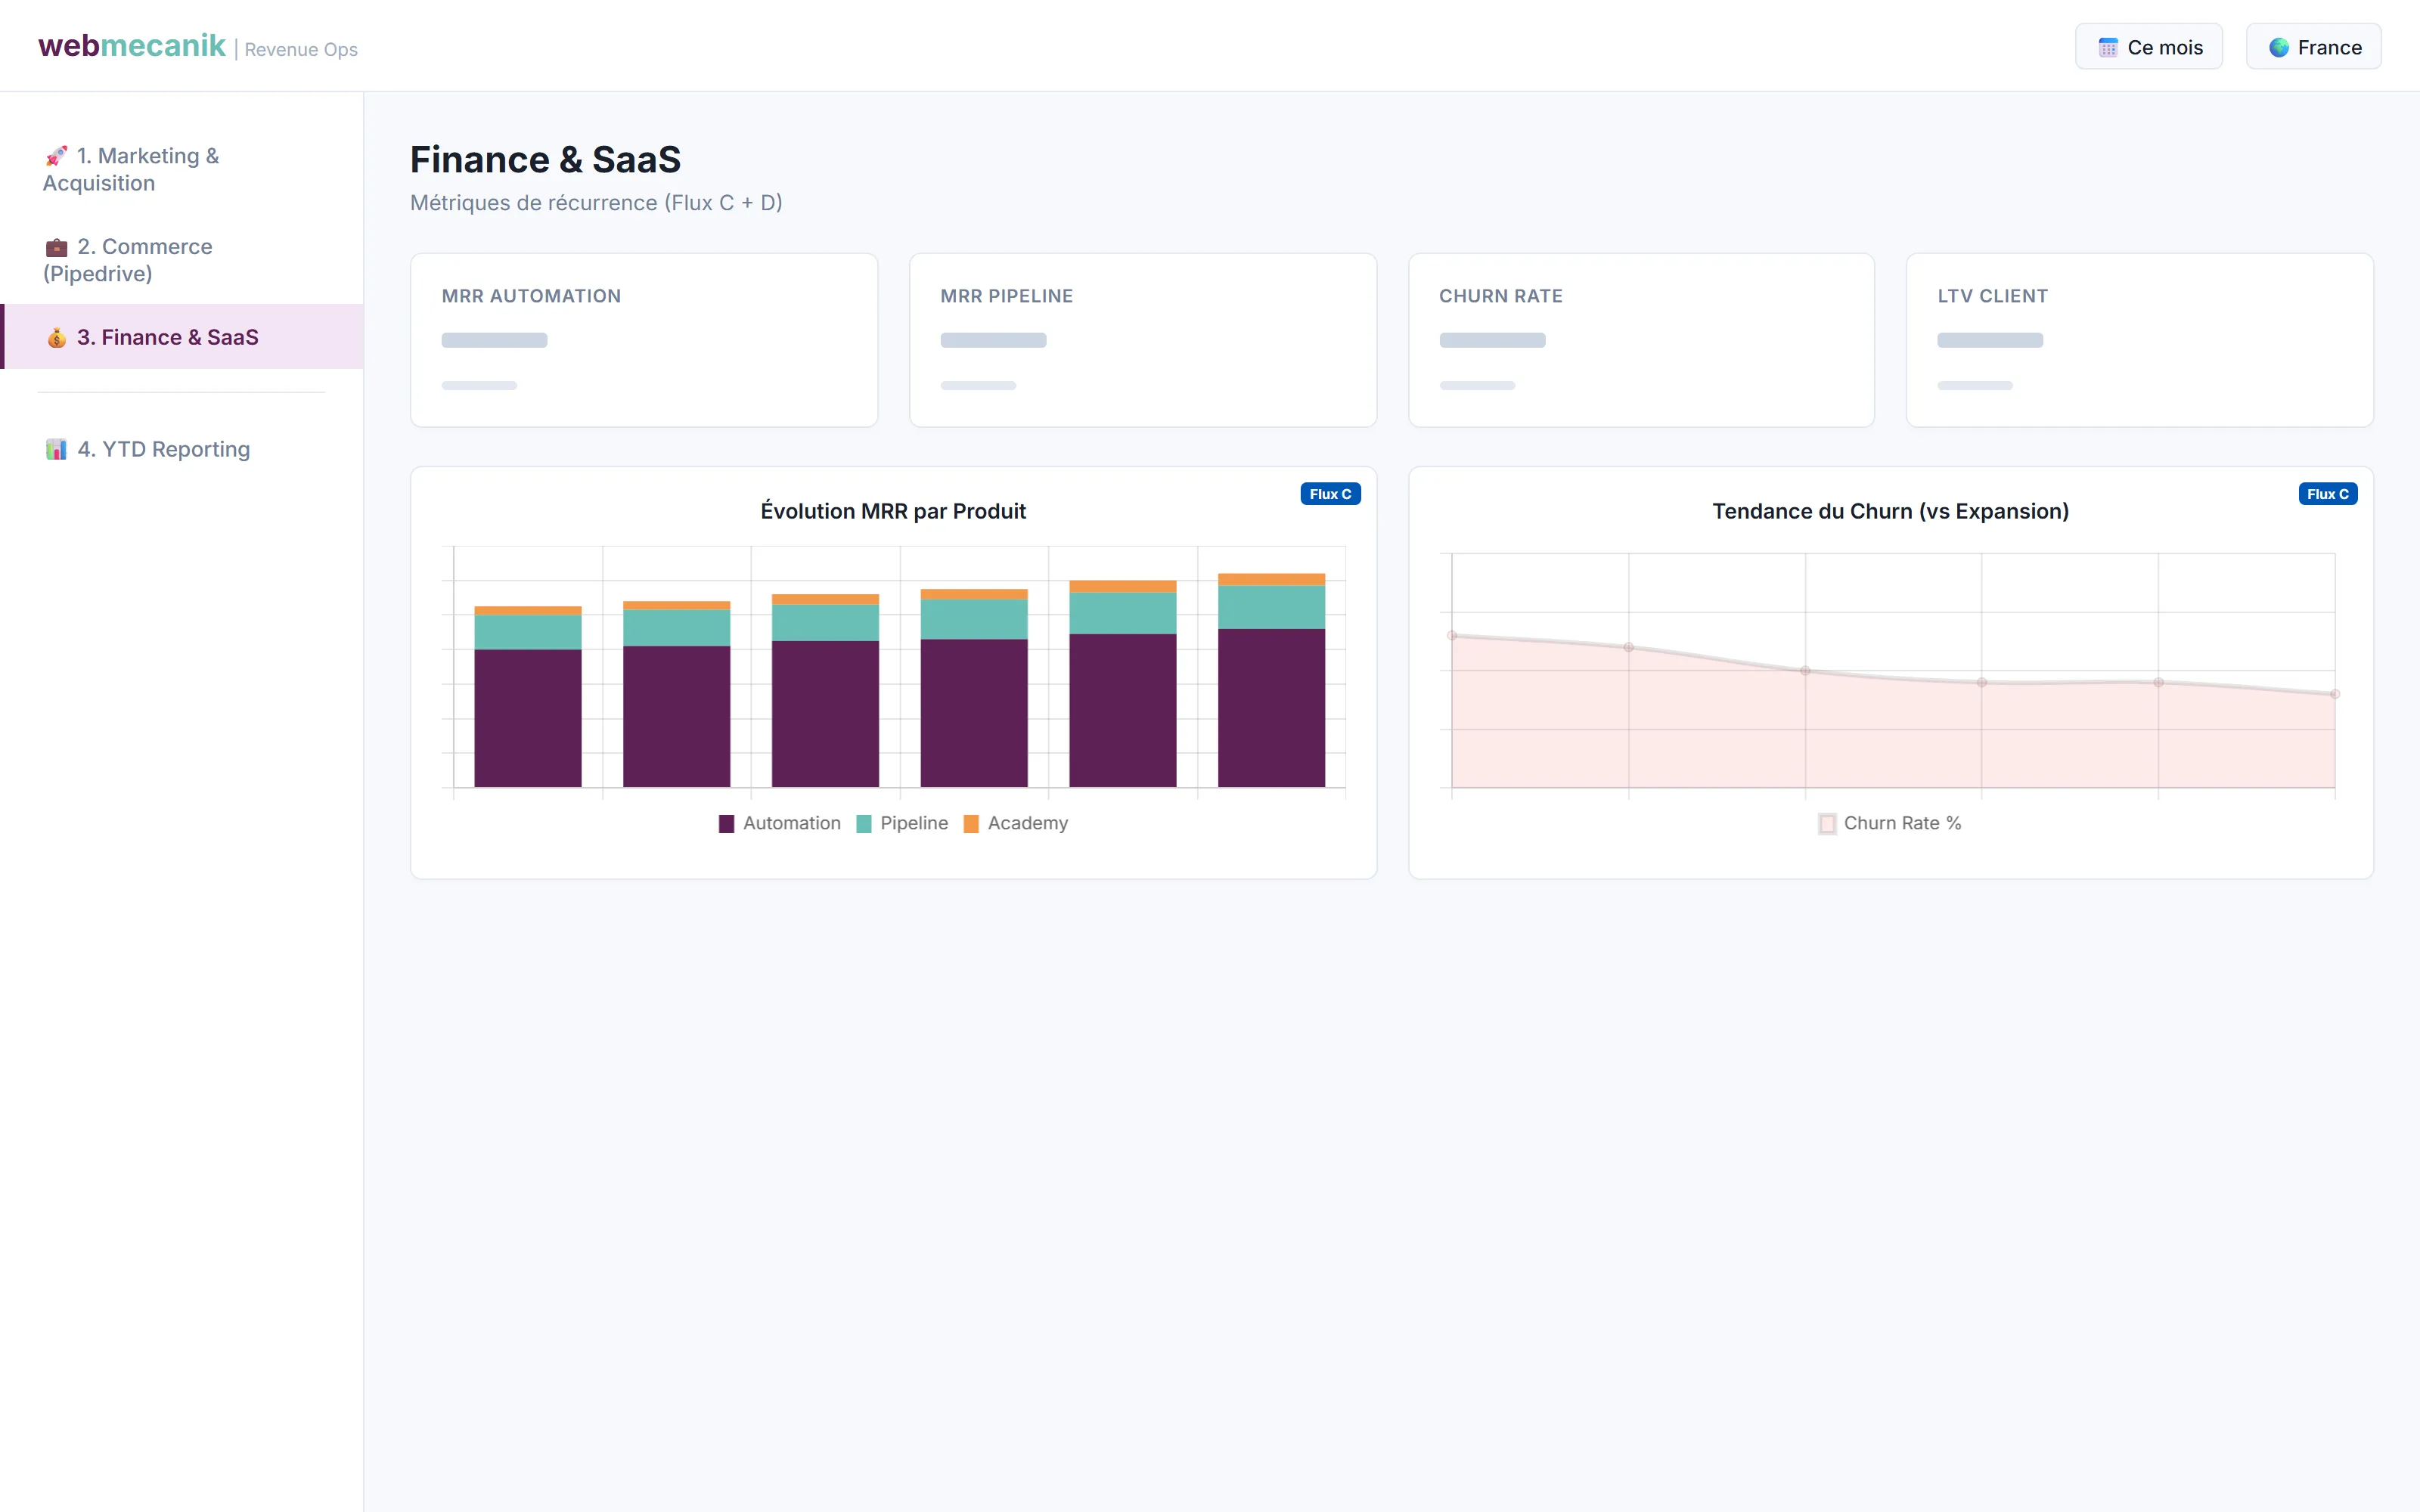
The CRM, the automation software, the subscription portal and the manual entries brought together in BigQuery, blended with GA4 in a single dashboard.
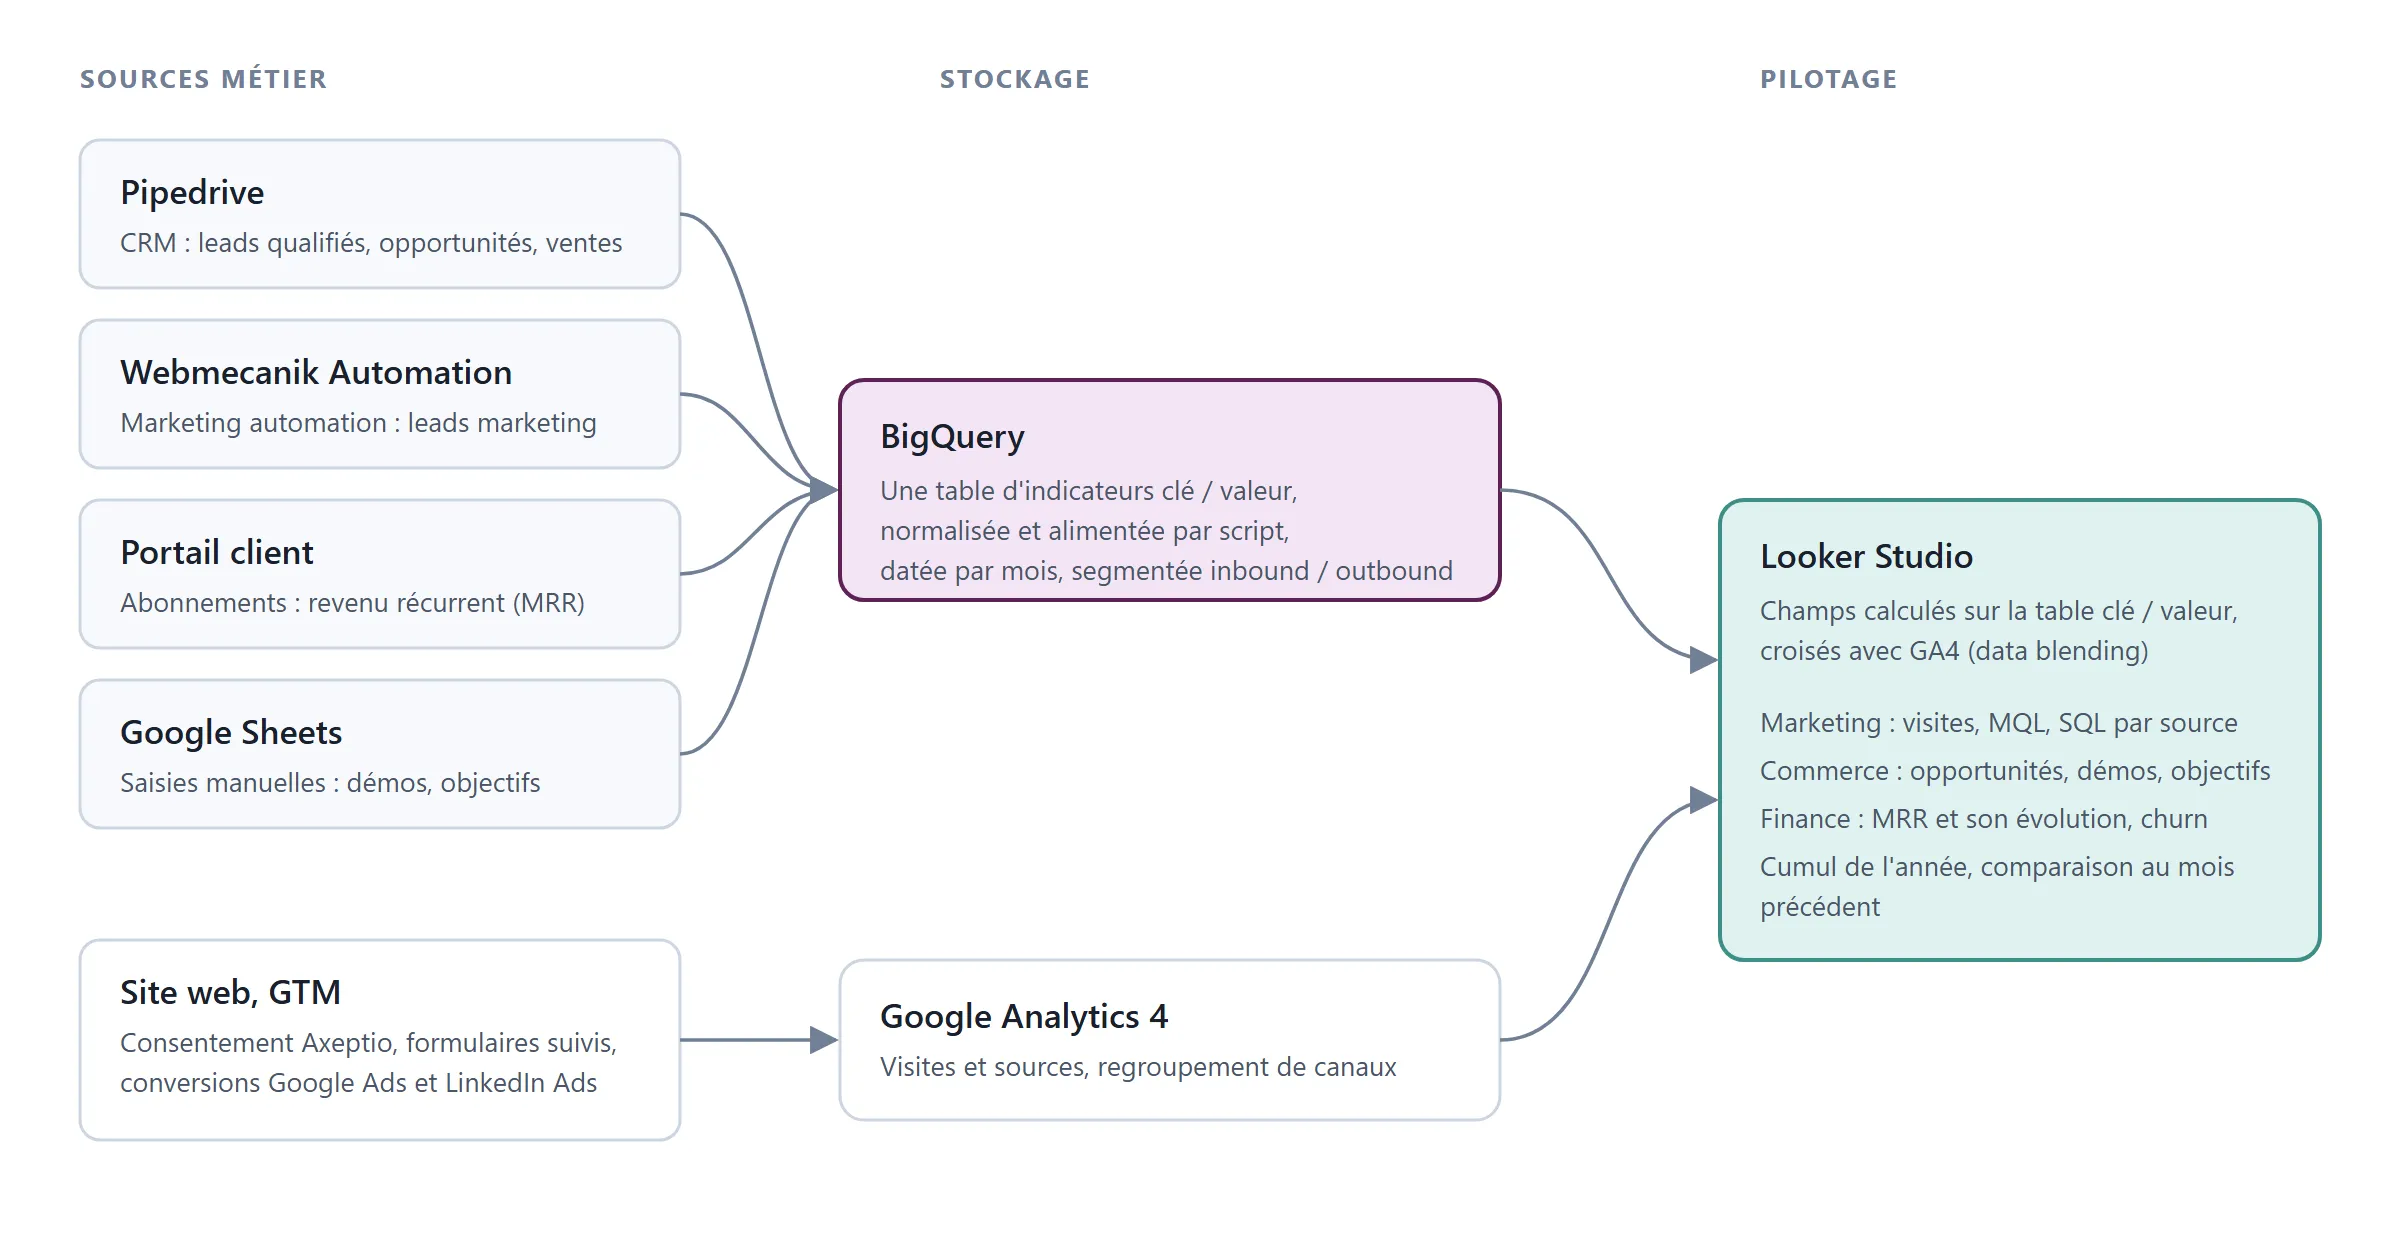
Webmecanik publishes a marketing automation software and a CRM. Its figures lived in four tools that did not talk to each other: the Pipedrive CRM, Webmecanik Automation, the subscription portal and Google Sheets. The management wanted a dashboard for every step of the funnel, from marketing to sales and financial health.
The model first
Before a single chart, I wrote the data flow instructions and the metrics dictionary, where every indicator has its formula (CAC Payback, LTV, churn). I also drew an interactive mock-up of the dashboard, before any access to the data.
When the client decided to bring its sources together in a database, I steered it from MySQL to BigQuery. Its CTO wrote the script that feeds the table; I specified its flows and keys.
The dashboard
I designed the Looker Studio dashboard on top of that table, blended with GA4: visits and their sources on one side, leads and recurring revenue on the other. It opens on the current year, and a chosen month is compared with the previous one.
A wrong figure, traced to its source
When the management saw a March figure that did not match its source, I queried the table before touching the display. The SQL check showed the gap was already in the client’s table: duplicates left by several updates, which the CTO fixed.
The handover
Upstream, I had rebuilt the site’s form tracking so that a new form plugs in without a new tag. The client leaves with a guide and three videos, and its marketing team adds its own conversions.
In pictures